Statistics
Baseline/Baseline Variables
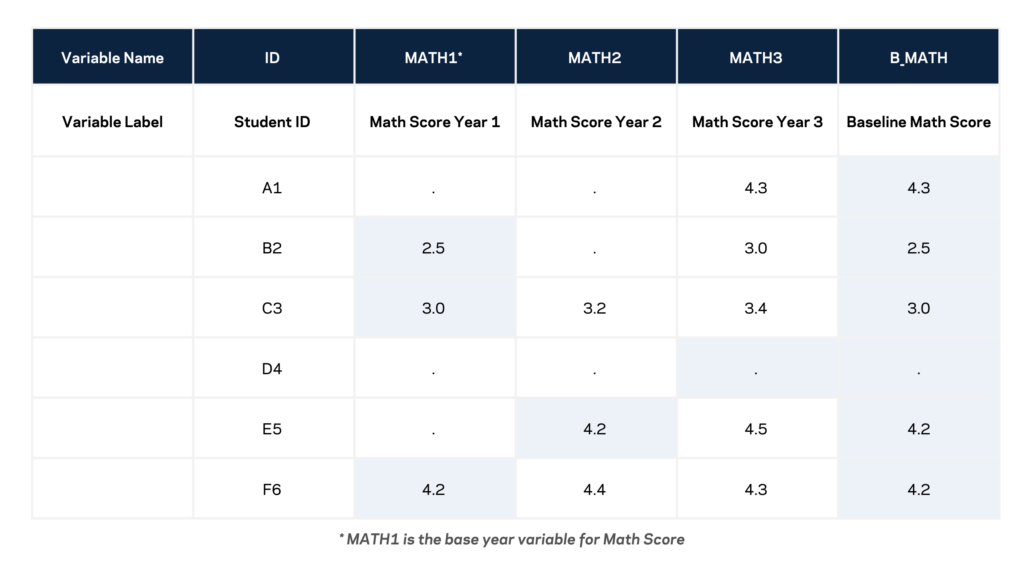
The term baseline denotes the initial valid measurement of a variable. Baseline variables are generated by collecting measurements at multiple time points and created using the merge and update options within Stata. With each additional wave of information, missing data is substituted and modified with the corresponding valid measurement.
Binary/Dummy/Flag Variable
Binary variables have a value of either 0 or 1, indicating whether the variable is “true” or “false.” For example, a binary variable that indicates whether a school is situated in a city would have two possible responses: 1, indicating that the school is located in a city, and 0, indicating that it is not. These variables are also known as indicator, dummy, or flag variables.
Categorical Variable
Categorical variables have character or integer values that denote specific categories. These values may be ordinal, such as a scale rating, or they may be nominal, in which case, they have no inherent connection to the number itself. For example, 1 could represent left-handedness, and 2 could signify right-handedness.
Composite Variable
A composite variable is “a variable made up of two or more variables or measures that are highly related to one another conceptually or statistically”1. For example, an IQ test produces a single score that is based on a series of responses to various questions. The responses are grouped to create one single measure of intelligence.
Continuous Variable
Continuous variables have all numeric values (including decimals, e.g. 1.1, 7.0, -30.4) indicating a measurement (e.g. height, math score).
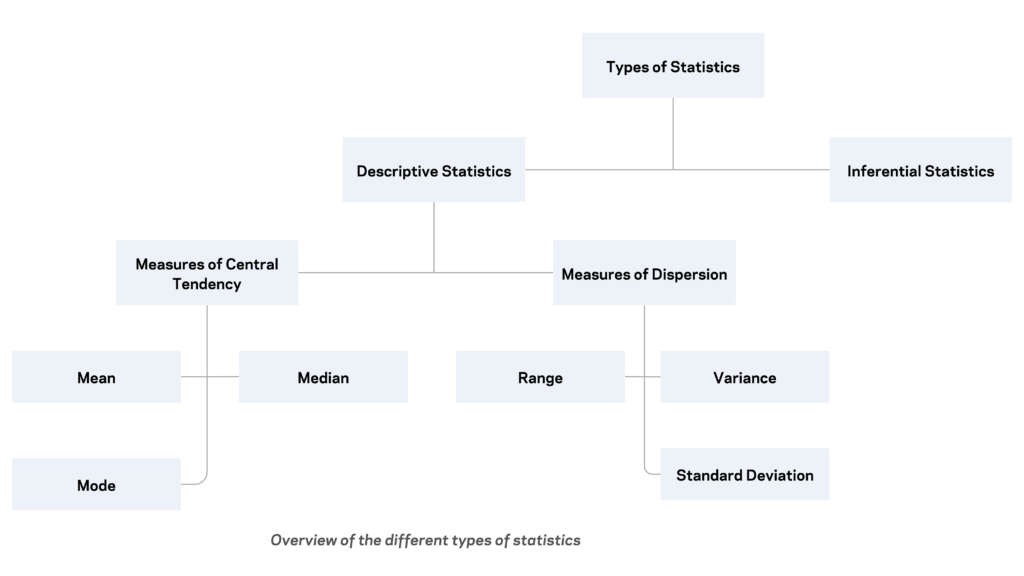
Descriptive Statistics
Descriptive statistics, or descriptives, refer to a summary of data that provides useful insights into the characteristics of the sample. In the case of categorical and discrete variables, descriptives generally include the mode, range, and frequency table of the responses. For continuous variables, descriptives typically include the mode, median, mean, and range, along with the distribution (such as a histogram or density curve) of the responses. By providing an overview of common values, descriptive statistics can help in understanding the data better.
Continuous Variables
Continuous variables have all numeric values (including decimals, e.g. 1.1, 7.0, -30.4) indicating a measurement (e.g. height, math score).
Discrete Variables
Discrete variables have integer values. These are often counts, like the number of absences in a year or the number of children in a school.
HLM – Hierarchical Linear Modeling
Hierarchical linear models, also known as multilevel models or mixed effects, are a statistical model that accounts for hierarchically structured data. This type of data structure contains variables that describe one base unit of analysis nested in more extensive units, with multiple micro-level units sampled for each macro-level unit. In other words, these data structures have multiple micro-level units sampled for each macro-level unit. For example, a hierarchical linear model of student achievement could have a model for students (taking into account variables such as income or gender), a model for the classrooms that the students use (factoring in variables like classroom size), and a model for the schools that the classrooms are in (accounting for variables like urban versus rural school sites). For further clarity, please refer to the “Units of Analysis” section.
Levels
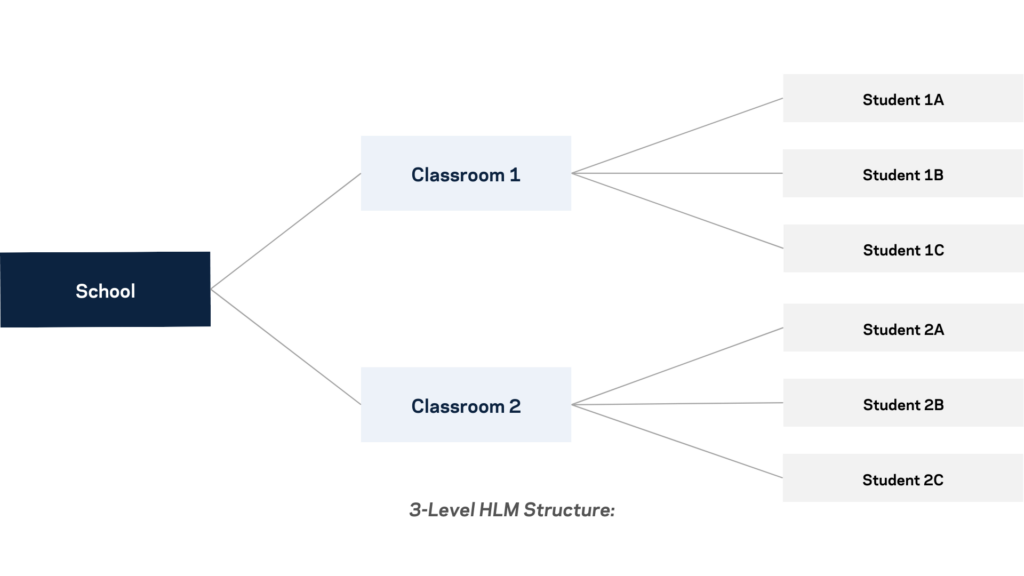
Levels of data/models refer to the different layers of the units. In the example above, the model would have three tiers: a student level (level 1), a classroom level (level 2), and a school level (level 3). The levels are linked via ID’s, meaning that each student (base unit of analysis) has a student ID, a classroom ID, and a school ID.
Modeling
Modeling is a statistical technique that assesses the correlation between outcome and predictor variables. Models aim to reflect the true data generating process. Examples of modeling approaches include regression, Bayesian inference, trees, neural networks, and more.
Regression
Regression describes a type of modeling that measures the relationship between the mean value of an outcome (e.g. reading scores) and the values of other variables (e.g. absences, math scores).
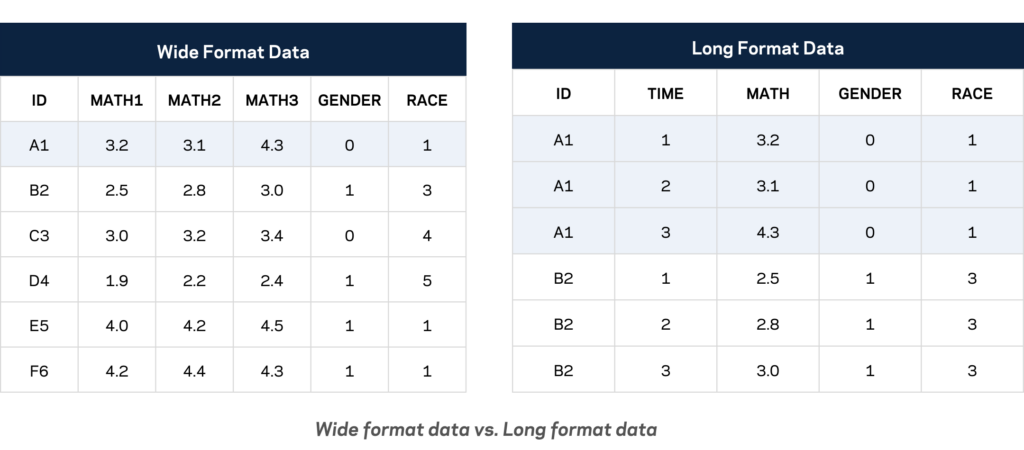
Wide vs. Long Format Data
Wide format data has one observation (row) for each unit of analysis (e.g. child), and multiple variables (columns) for each wave of data collection. Long format data has multiple observations (rows) for each unit of analysis (e.g. child), and a single variable (column) with multiple entries for each wave of data collection. See the example below.
Unit of Analysis
In a model or dataset, the unit of analysis means each observation (row). It can refer to time, individuals, schools, countries, and more. From the example seen in levels illustration, the level-1 unit of analysis would be students, meaning that each row of the dataset would correspond to a single student. The level-2 unit of analysis would be a classroom, meaning that each row of the dataset would correspond to a classroom, in which the students are nested in. The level-3 unit of analysis would be schools, meaning that each row of the dataset would correspond to a school, in which the classrooms are nested in.
- Song, M. K., Lin, F. C., Ward S. E., and Fine, J. P. “Composite Variables: When and how.” Nursing Research 62, no. 1 (2013): 45-49. https://doi.org/10.1097/NNR.0b013e3182741948.
↩︎